Data set of ozone measurements at 20 Chicago monitoring stations.
ozone.RdThis data set used be named ozone but was
changed to avoid conflict with other packages.
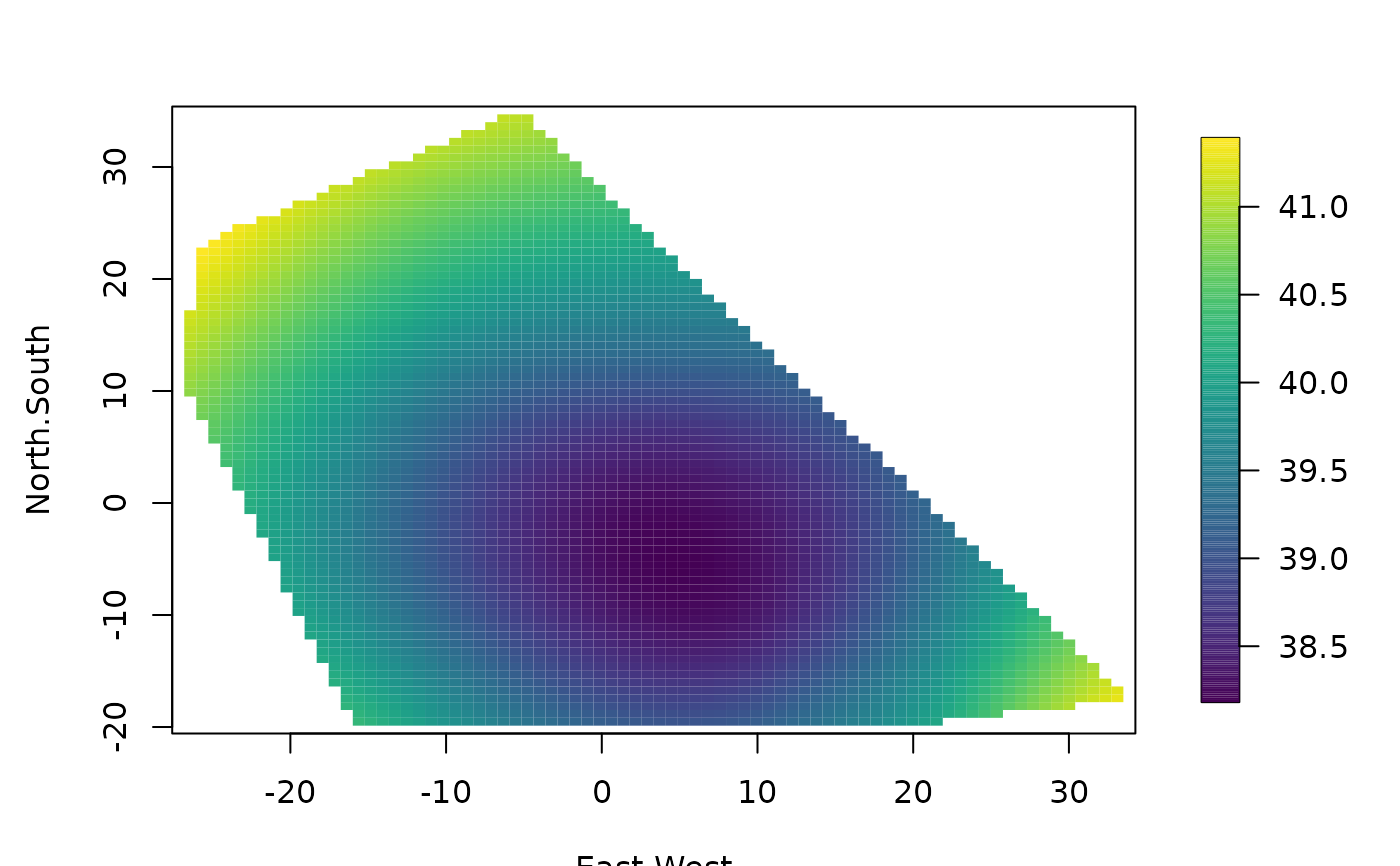
The ChicagoO3 data is a list of
components, x and y. x
component is longitude and latitude position of each of the 20
Chicago monitoring stations, y is the average
daily ozone values over the time period 6/3/87-8/30/87.
These data are used extensively for the test scripts and
simple examples. The lasting scientific value is probably
minimal.
Format
This data set is a list containing the following components:
- lon.lat
Longitude-latitude positions of monitoring stations.
- x
An approximate Cartesian set of coordinates for the locations where the units are in miles. The origin is in the center of the locations.
- y
Average daily ozone values over 1987 summer.
Source
AIRS, the EPA air quality data base.
See also
Tps, Krig