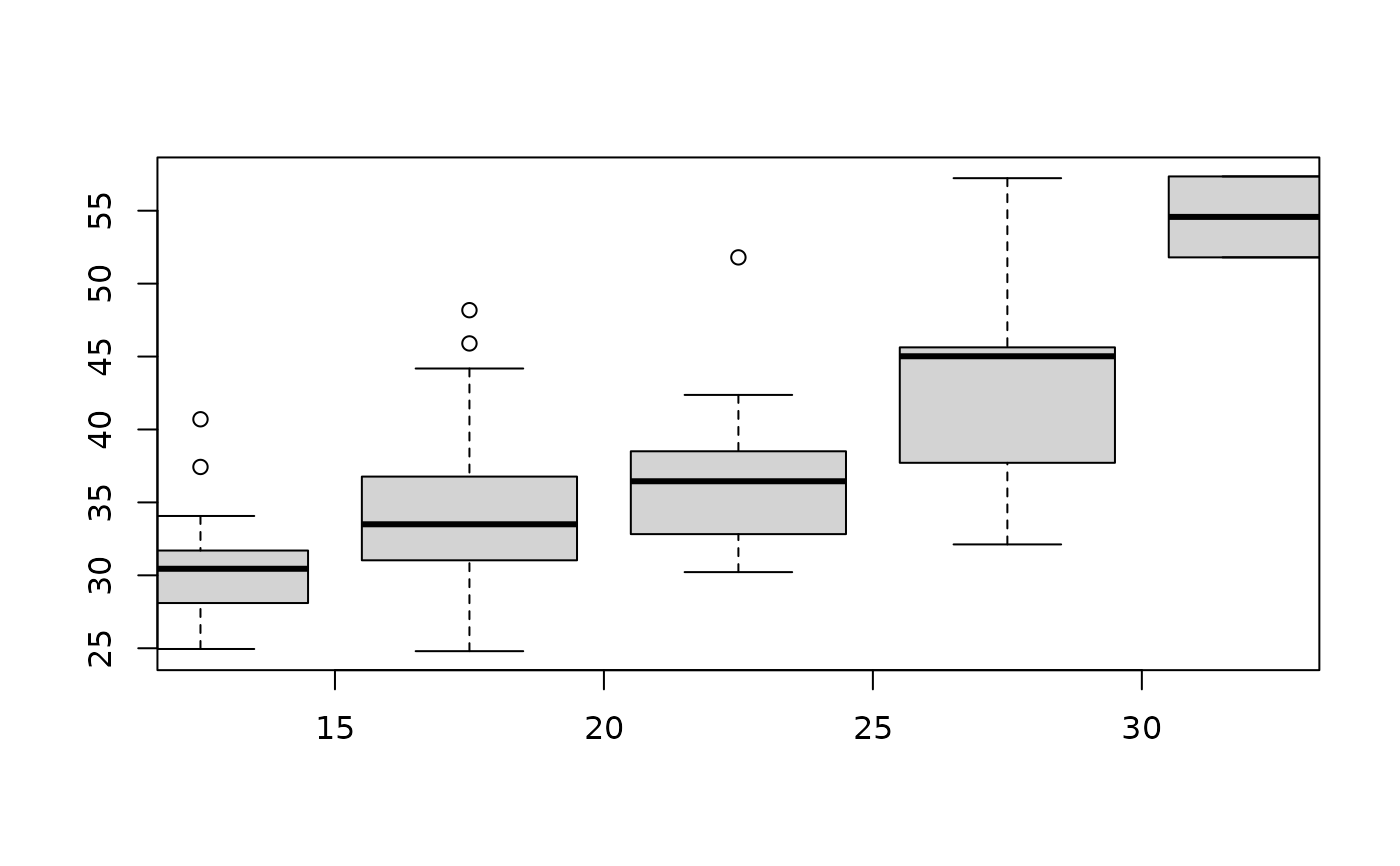
Boxplots for conditional distribution
bplot.xy.RdDraws boxplots for y by binning on x. This gives a coarse, but quick, representation of the conditional distrubtion of [Y|X] in terms of boxplots.
bplot.xy(x, y, N = 10, breaks = pretty(x, N, eps.correct = 1),
                 plot = TRUE, axes = TRUE, ...)
Arguments
- x
Vector to use for bin membership
- y
Vector to use for constructing boxplot statistics.
- N
Number of bins on x. Default is 10.
- breaks
Break points defining bin boundaries. These can be unequally spaced.
- plot
If FALSE just returns a list with the statistics used for plotting the box plots, bin centers, etc. -- More stuff than you can imagine!
- axes
The usual plotting argument -- If TRUE then axes are plotted.
- ...
Any other optional arguments passed to the standard
boxplotfunction.
See also
bplot, draw.bplot
Examples
# condition on swim times to see how run times vary
bplot.xy( minitri$swim, minitri$run, N=5)
 # bivariate normal corr= .8
set.seed( 123)
x<-rnorm( 2000)
y<- .8*x + sqrt( 1- .8**2)*rnorm( 200)
#
bplot.xy(x,y)
# bivariate normal corr= .8
set.seed( 123)
x<-rnorm( 2000)
y<- .8*x + sqrt( 1- .8**2)*rnorm( 200)
#
bplot.xy(x,y)
 #
bplot.xy( x,y, breaks=seq( -3, 3,,25) ,
xlim =c(-4,4), ylim =c(-4,4), col="grey80", lwd=2)
points( x,y,col=3, cex=.5)
#
bplot.xy( x,y, breaks=seq( -3, 3,,25) ,
xlim =c(-4,4), ylim =c(-4,4), col="grey80", lwd=2)
points( x,y,col=3, cex=.5)