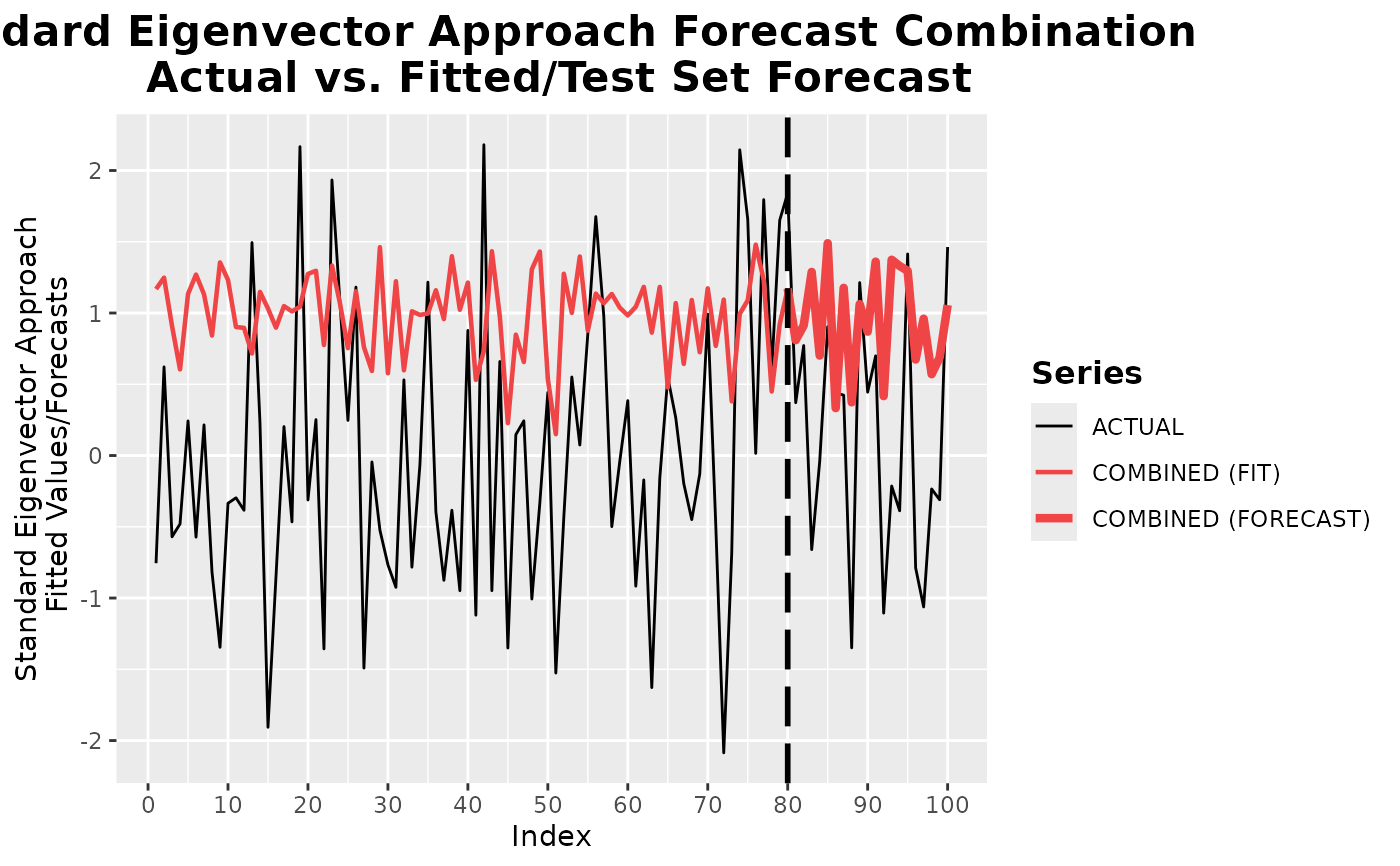
Produces plots for the results of a forecast combination method. Either
an actual vs. fitted plot (which = 1) or a barplot of the combination weights
(which = 2).
# S3 method for foreccomb_res
plot(x, which = 1, ...)
Arguments
- x
An object of class 'foreccomb_res'.
- which
Type of plot: 1 = actual vs. fitted, 2 = combination weights.
- ...
Other arguments passing to
plot.default.
Value
A plot for the foreccomb_res class.
See also
Examples
obs <- rnorm(100)
preds <- matrix(rnorm(1000, 1), 100, 10)
train_o<-obs[1:80]
train_p<-preds[1:80,]
test_o<-obs[81:100]
test_p<-preds[81:100,]

data<-foreccomb(train_o, train_p, test_o, test_p)
fit <- comb_EIG1(data)
plot(fit)
#> Warning: Use of `pl$Actual` is discouraged.
#> ℹ Use `Actual` instead.
#> Warning: Use of `pl$Combined_Fit` is discouraged.
#> ℹ Use `Combined_Fit` instead.
#> Warning: Use of `pl$Combined_Forecast` is discouraged.
#> ℹ Use `Combined_Forecast` instead.