Bilinear interpolation for 3d array
spInterp_bilinear.RdBilinear interpolation for 3d array
spInterp_bilinear(
  z,
  dims = NULL,
  range = c(70, 140, 15, 55),
  res = 1,
  na.rm = TRUE,
  convertTo2d = FALSE
)
Arguments
- z
3d array (lon, lat, time), with the dimension of
[nlon, nlat, ntime].image(z[,,1])should look normal.- dims
A list object with
lonandlat.lon: numeric,[nlon]lat: numeric,[nlat]
- range
[xmin, xmax, ymin, ymax]- res
the grid resolution (degree)
- na.rm
If true, Na value in margin will be fixed.
- convertTo2d
boolean (default false),
FALSE: a 3d array will be returned,[nlon, nlat, ntime]TRUE: a 2d array will be returned,[nlon*nlat, ntime]
Note
High resolution interpolating to low resolution will lead to unreliable
result, if cellsize.new/cellsize.origin > 2.
Examples
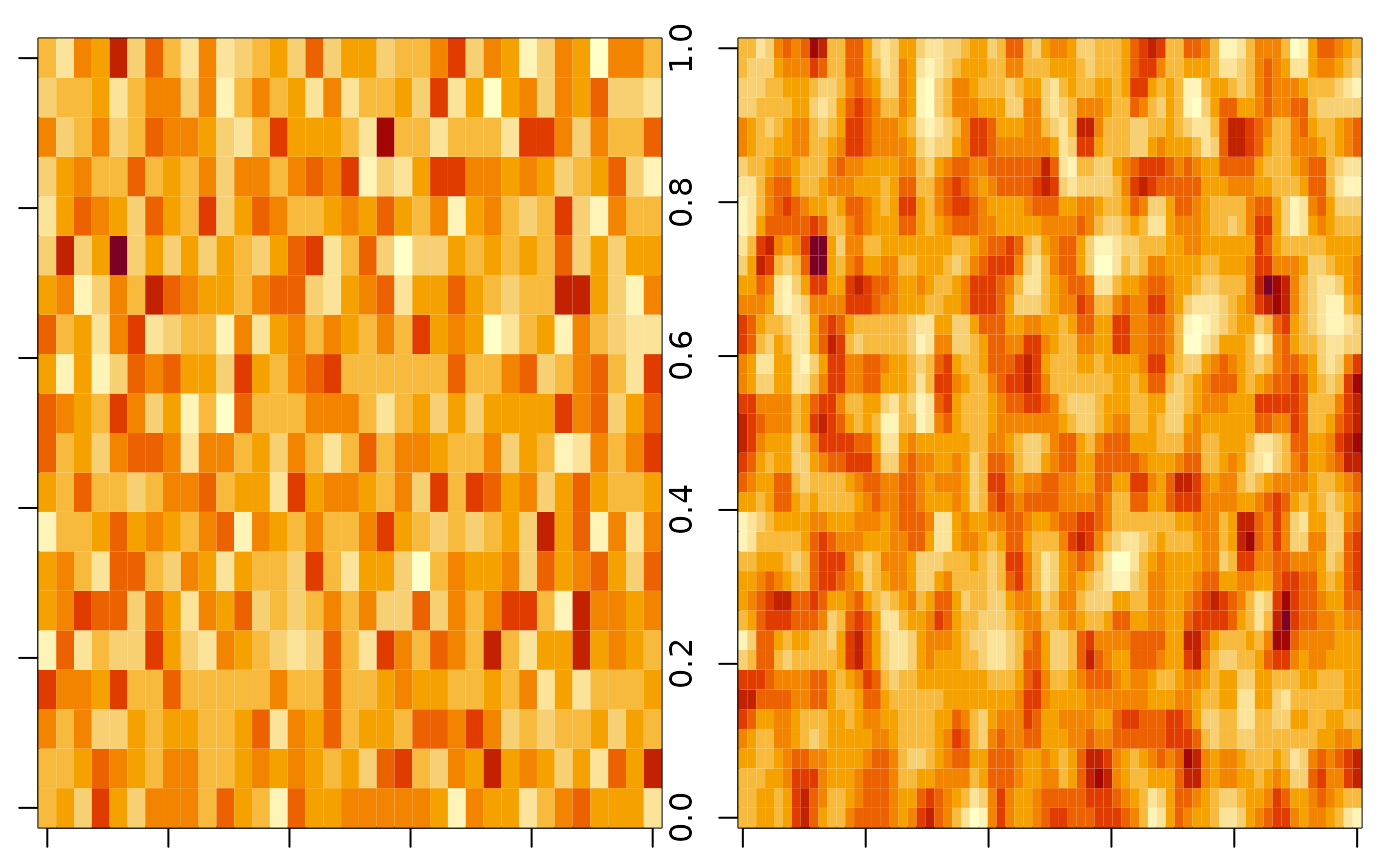
set.seed(1)
## first example: simulated data
range = c(70, 140, 15, 55)
dims = make_dims(range, res = 2)
nlat <- length(dims$lat)
nlon <- length(dims$lon)
ntime <- 10
z <- array(rnorm(nlon*nlat*ntime), c(nlon, nlat, ntime))
z_bl <- spInterp_bilinear(z, dims, range, res = 1)
par(mfrow = c(1, 2), mar = c(1, 1, 1, 1))
image(z[,,1])
image(z_bl[,,1])
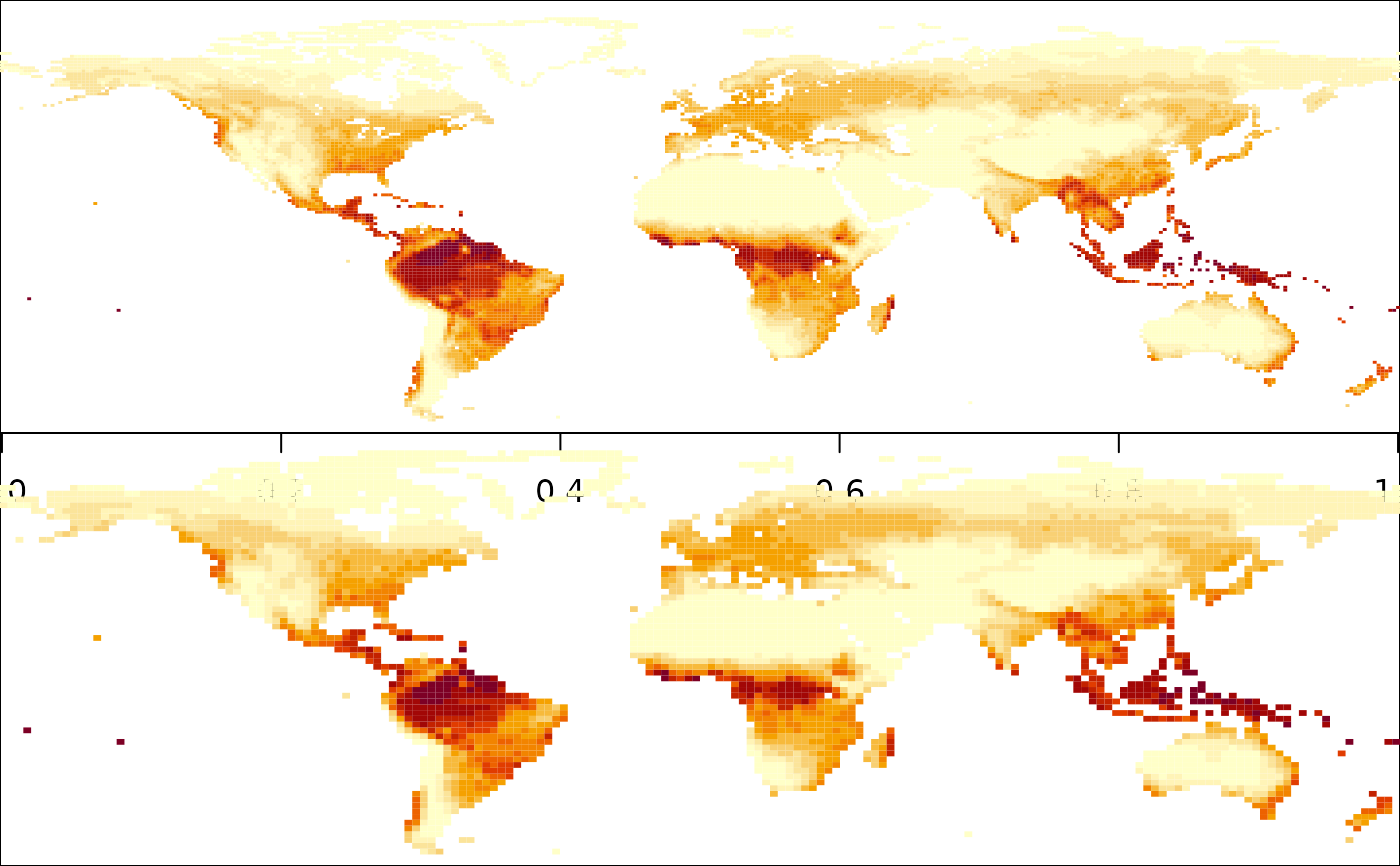
 ## second example: real data
# f = system.file("inst/extdata/PMLV2_veg-dynamic_GPP_2014.tif", package = "spInterp")
# PMLV2_2014_gpp = terra::rast(f) %>% sf2::rast_array()
arr = PMLV2_2014_gpp
interp_PML <- function(arr, res = 2, plot = FALSE) {
range = c(-180, 180, -60, 90)
dims = make_dims(range, res = 1)
arr_bl <- spInterp_bilinear(arr, dims, range, res = res)
if (plot) {
par(mfrow = c(2, 1), mar = c(0, 0, 0, 0))
image(arr[,,1])
image(arr_bl[,,1])
}
arr_bl
}
arr_deg2_v0 = interp_PML(arr, res = 2, plot = TRUE)
## second example: real data
# f = system.file("inst/extdata/PMLV2_veg-dynamic_GPP_2014.tif", package = "spInterp")
# PMLV2_2014_gpp = terra::rast(f) %>% sf2::rast_array()
arr = PMLV2_2014_gpp
interp_PML <- function(arr, res = 2, plot = FALSE) {
range = c(-180, 180, -60, 90)
dims = make_dims(range, res = 1)
arr_bl <- spInterp_bilinear(arr, dims, range, res = res)
if (plot) {
par(mfrow = c(2, 1), mar = c(0, 0, 0, 0))
image(arr[,,1])
image(arr_bl[,,1])
}
arr_bl
}
arr_deg2_v0 = interp_PML(arr, res = 2, plot = TRUE)
 arr_deg2_v1 = interp_PML(arr[,,1], res = 2)
all.equal(arr_deg2_v0, arr_deg2_v1)
#> [1] TRUE
arr_deg05 = interp_PML(arr, res = 0.5, plot = TRUE)
arr_deg2_v1 = interp_PML(arr[,,1], res = 2)
all.equal(arr_deg2_v0, arr_deg2_v1)
#> [1] TRUE
arr_deg05 = interp_PML(arr, res = 0.5, plot = TRUE)
 # Ipaper::write_fig({ tmp = interp_PML(arr, res = 0.5, TRUE)}, "bilinear_gpp.png", 8, 6)
# Ipaper::write_fig({ tmp = interp_PML(arr, res = 2, TRUE)}, "bilinear_gpp.png", 8, 6)
# Ipaper::write_fig({ tmp = interp_PML(arr, res = 0.5, TRUE)}, "bilinear_gpp.png", 8, 6)
# Ipaper::write_fig({ tmp = interp_PML(arr, res = 2, TRUE)}, "bilinear_gpp.png", 8, 6)