calculate slope of rast object
Arguments
- r
A yearly rast object, which should have time attribute
- period
c(year_begin, year_end)- outfile
The path of outputed tiff file. If specified,
slopeandpvaluewill be written intooutfile.- fun
the function used to calculate slope, see
slope()for details.- ...
other parameters ignored
- overwrite
logical. If
TRUE,outfileis overwritten.- .progress
name of the progress bar to use, see
create_progress_bar
Value
A terra rast object, with bands of slope and pvalue.
See also
Examples
library(rtrend)
library(terra)
#> terra 1.9.11
#>
#> Attaching package: ‘terra’
#> The following object is masked from ‘package:rtrend’:
#>
#> chunk
f <- system.file("rast/MOD15A2_LAI_China_G050_2001-2020.tif", package = "rtrend")
r <- rast(f)
r
#> class : SpatRaster
#> size : 80, 140, 20 (nrow, ncol, nlyr)
#> resolution : 0.5, 0.5 (x, y)
#> extent : 70, 140, 15, 55 (xmin, xmax, ymin, ymax)
#> coord. ref. : lon/lat WGS 84 (EPSG:4326)
#> source : MOD15A2_LAI_China_G050_2001-2020.tif
#> names : LAI, LAI, LAI, LAI, LAI, LAI, ...
#> min values : 0.000000, 0.000000, 0.000000, 0.00000, 0.000000, 0.000000, ...
#> max values : 5.692542, 5.479348, 5.585326, 5.33587, 5.822826, 5.533152, ...
#> time (days) : 2001-01-01 to 2020-01-01 (20 steps)
time(r)
#> [1] "2001-01-01" "2002-01-01" "2003-01-01" "2004-01-01" "2005-01-01"
#> [6] "2006-01-01" "2007-01-01" "2008-01-01" "2009-01-01" "2010-01-01"
#> [11] "2011-01-01" "2012-01-01" "2013-01-01" "2014-01-01" "2015-01-01"
#> [16] "2016-01-01" "2017-01-01" "2018-01-01" "2019-01-01" "2020-01-01"
slp <- slope_rast(r,
period = c(2001, 2020),
outfile = "LAI_trend.tif", overwrite = TRUE,
fun = rtrend::slope_mk, .progress = "none"
)
# if you want to show progress, set `.progress = "text"`
slp
#> class : SpatRaster
#> size : 80, 140, 2 (nrow, ncol, nlyr)
#> resolution : 0.5, 0.5 (x, y)
#> extent : 70, 140, 15, 55 (xmin, xmax, ymin, ymax)
#> coord. ref. : lon/lat WGS 84 (EPSG:4326)
#> source(s) : memory
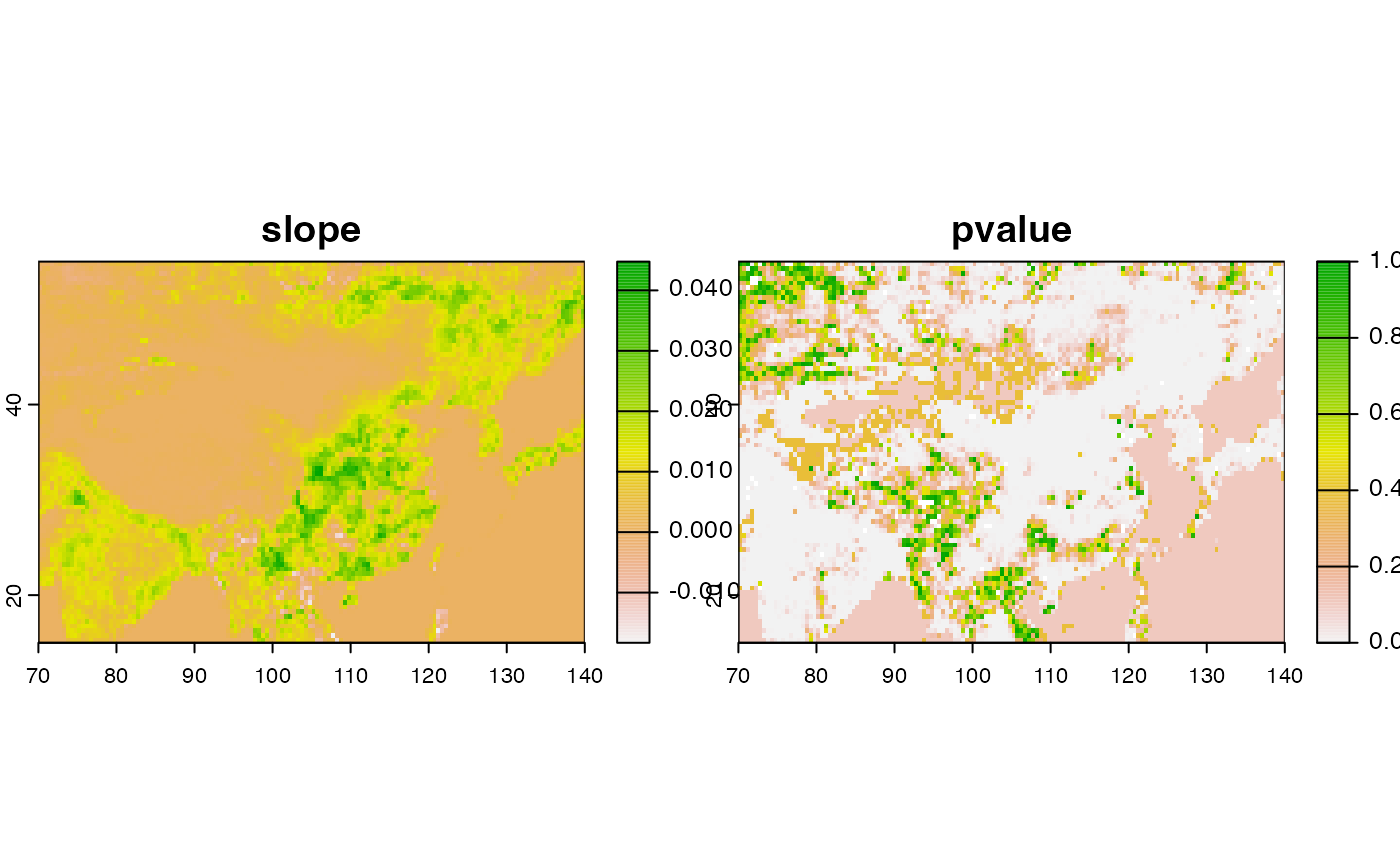
#> names : slope, pvalue
#> min values : -0.01830315, 0
#> max values : 0.04475858, 1
plot(slp)
 file.remove("LAI_trend.tif")
#> [1] TRUE
file.remove("LAI_trend.tif")
#> [1] TRUE