If valid observations <= 5, NA will be returned.
mkTrend_r(y, ci = 0.95, IsPlot = FALSE)

mkTrend(y, x = seq_along(y), ci = 0.95, IsPlot = FALSE)
Arguments
- y
numeric vector
- ci
critical value of autocorrelation
- IsPlot
boolean
- x
(optional) numeric vector
Value
Z0: The original (non corrected) Mann-Kendall test Z statistic.pval0: The original (non corrected) Mann-Kendall test p-valueZ: The new Z statistic after applying the correctionpval: Corrected p-value after accounting for serial autocorrelationN/n*sValue of the correction factor, representing the quotient of the number of samples N divided by the effective sample sizen*sslp: Sen slope, The slope of the (linear) trend according to Sen test
Details
mkTrend is 4-fold faster with .lm.fit.
Note
slp is significant, if pval < alpha.
References
Hipel, K.W. and McLeod, A.I. (1994), Time Series Modelling of Water Resources and Environmental Systems. New York: Elsevier Science.
Libiseller, C. and Grimvall, A., (2002), Performance of partial Mann-Kendall tests for trend detection in the presence of covariates. Environmetrics 13, 71--84, doi:10.1002/env.507 .
See also
fume::mktrend and trend::mk.test
Examples
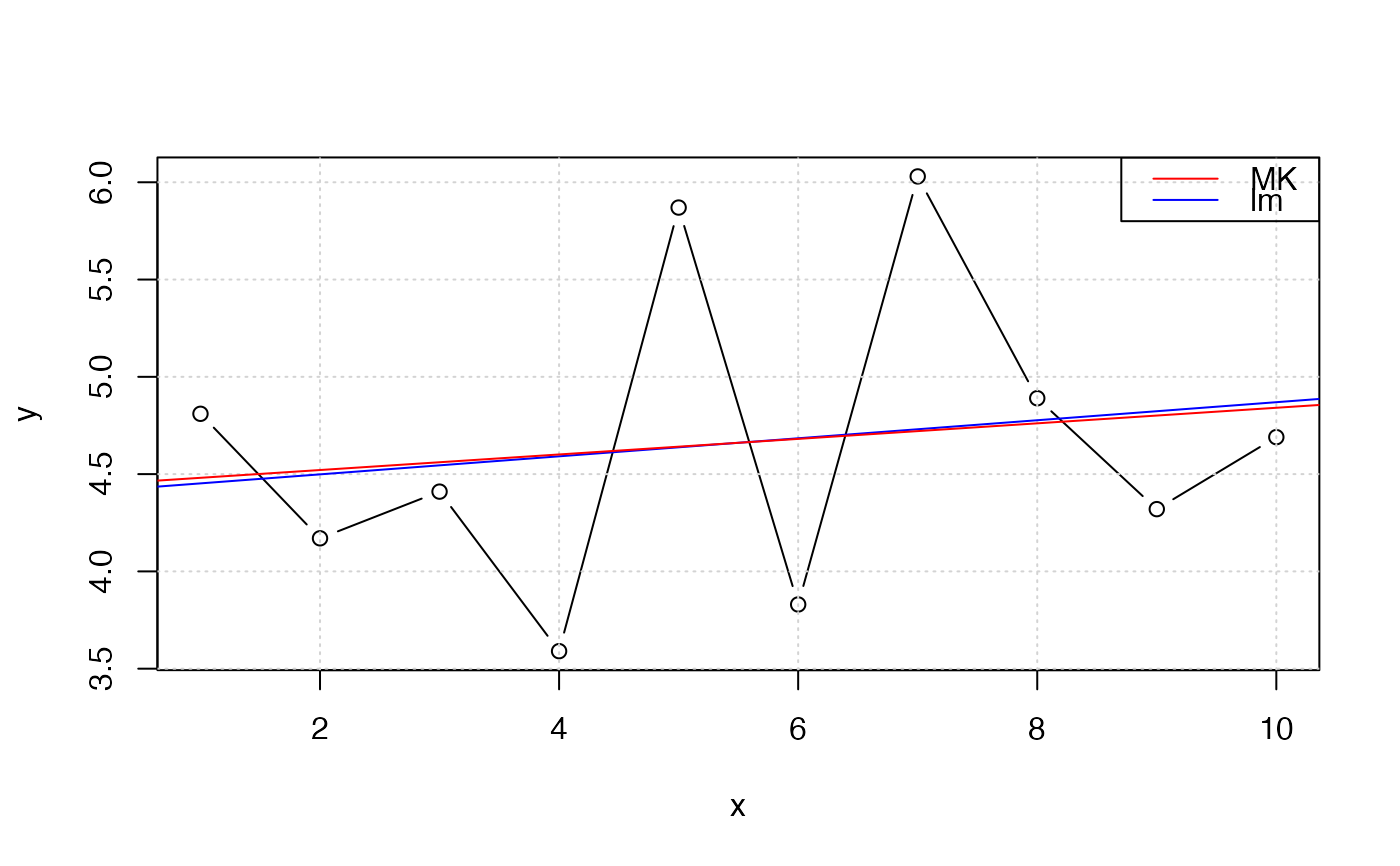
x <- c(4.81, 4.17, 4.41, 3.59, 5.87, 3.83, 6.03, 4.89, 4.32, 4.69)
r <- mkTrend(x)
r_cpp <- mkTrend(x, IsPlot = TRUE)
