make_colorbar
make_colorbar.Rdmake_colorbar
make_colorbar(
  at,
  labels = NULL,
  labeller = format,
  space = "right",
  width = 2,
  height = 1,
  col = NULL,
  alpha = 1,
  pretty = FALSE,
  equispaced = TRUE,
  tick.number = 7,
  tck = 0.3,
  tck.padding = 0,
  raster = FALSE,
  interpolate = FALSE,
  tri.upper = NA,
  tri.lower = NA,
  legend.line = element_line(linewidth = 0.8),
  legend.box = element_rect(linewidth = 0.5),
  hjust = 0.5,
  vjust = 0.5,
  size = 12,
  family = "Times",
  legend.text.location = c(0.5, 0.5),
  legend.margin = bb_margin(),
  title = NULL,
  legend.text = element_text(hjust = 0.5),
  legend.title = element_text(),
  fct.title.height = 1.8,
  padding.left = unit(2, "points"),
  padding.right = unit(2, "points"),
  ...,
  draw = FALSE,
  vp = NULL
)
Arguments
- legend.box
arrangement of multiple legends ("horizontal" or "vertical")
- hjust, vjust
used in
grid::grid.layout()- legend.margin
the margin around each legend (
margin()); inherits frommargins.- title
all title elements: plot, axes, legends (
element_text(); inherits fromtext)- legend.text
cex:col:font:fontfamily: The font familyfontface: The font face (bold, italic, ...)lineheight:
- legend.title
title of legend (
element_text(); inherits fromtitle)- padding.left, padding.right
padding in the left and right of the legend
- ...
additional element specifications not part of base ggplot2. In general, these should also be defined in the
element treeargument. Splicing a list is also supported.- draw
A logical value indicating whether graphics output should be produced.
- vp
A Grid viewport object (or NULL).
Examples
library(ggplot2)
library(rcolors)
library(magrittr)
library(glue)
## example 01
spaces <- c("right", "left", "top", "bottom") # %>% set_names(., .)
make_cbar <- function(brks, space, outfile = NULL) {
# brks <- 1:5
nbrk <- length(brks) - 1
cols <- rcolors::get_color("amwg256", nbrk)
g <- make_colorbar(
at = brks, col = cols,
space = space, title = space
)
if (!is.null(outfile)) {
if (require(Ipaper))
Ipaper::write_fig(g, outfile, 10, 6)
}
g
}
brks = 1:5 %>% c(-Inf, ., Inf)
spaces <- c("right", "left", "top", "bottom")
ps = lapply(spaces, function(space) {
fout = glue("cbar_{space}.pdf")
fout = NULL
make_cbar(brks, space, fout)
})
g = cowplot::plot_grid(plotlist = ps)
# g = patchwork::wrap_plots(ps)
# grid.newpage(); grid.draw(g)
# Ipaper::write_fig(g, "Rplot.pdf", 10, 6) # uncomment if want to show figure
## example 02
brks = c(-Inf, -1, 0, 1, 3, 6, 9, Inf)
# brks = 1:10
nbrk = length(brks) - 1
cols = get_color(rcolors$amwg256, nbrk)
spaces = c("right", "left", "top", "bottom") #%>% set_names(., .)
params <- list(
at = brks, col = cols, height = 1,
tck = 0.4,
# padding.left = unit(2, "points"),
# padding.right = unit(2, "points"),
space = spaces[1],
# legend.line = element_line(size = 0.1, linetype = 1, color = "black"),
# legend.text = element_text(hjust = 0.5),
legend.text.location = c(0.2, 0.5),
# legend.margin = bb_margin(t = 0.1),
# legend.text.just = c(0.5, 0.5),
# title = NULL,
title = "d/decade",
fct.title.height = 3,
legend.title = element_text(size = 14)
# legend.box = element_rect(size = 0.5),
# legend.line = element_line(size = 1),
# legend.text = list(fontfamily = "Times", cex = 1.1),
# hjust = 0.5
)
cbar <- do.call(make_colorbar, params)
# write_fig(cbar, "a.pdf", 0.9, 6)
# cowplot::plot_grid(plotlist = lst)
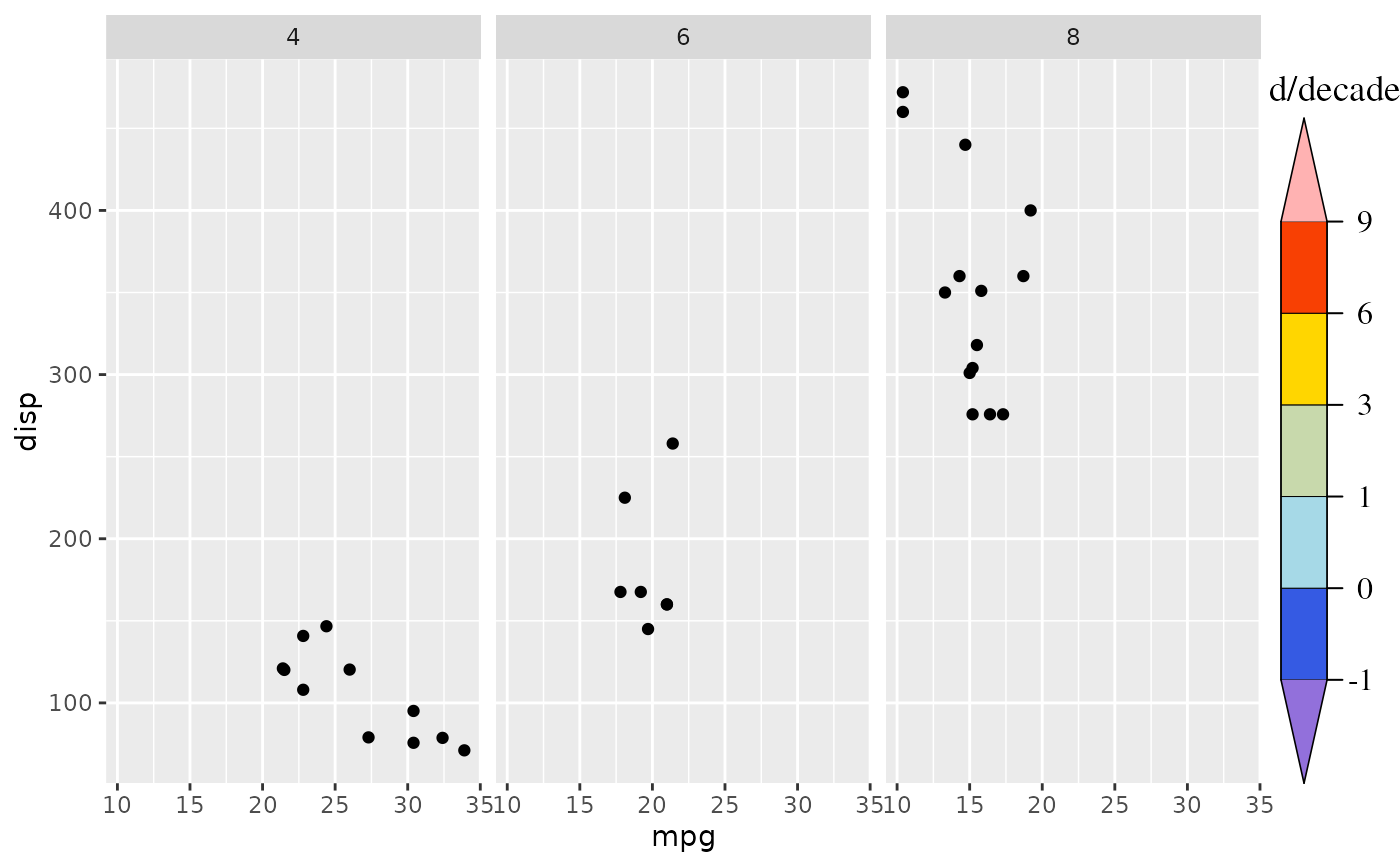
p <- ggplot(mtcars, aes(mpg, disp)) + geom_point() +
facet_wrap(~cyl)
p + cbar
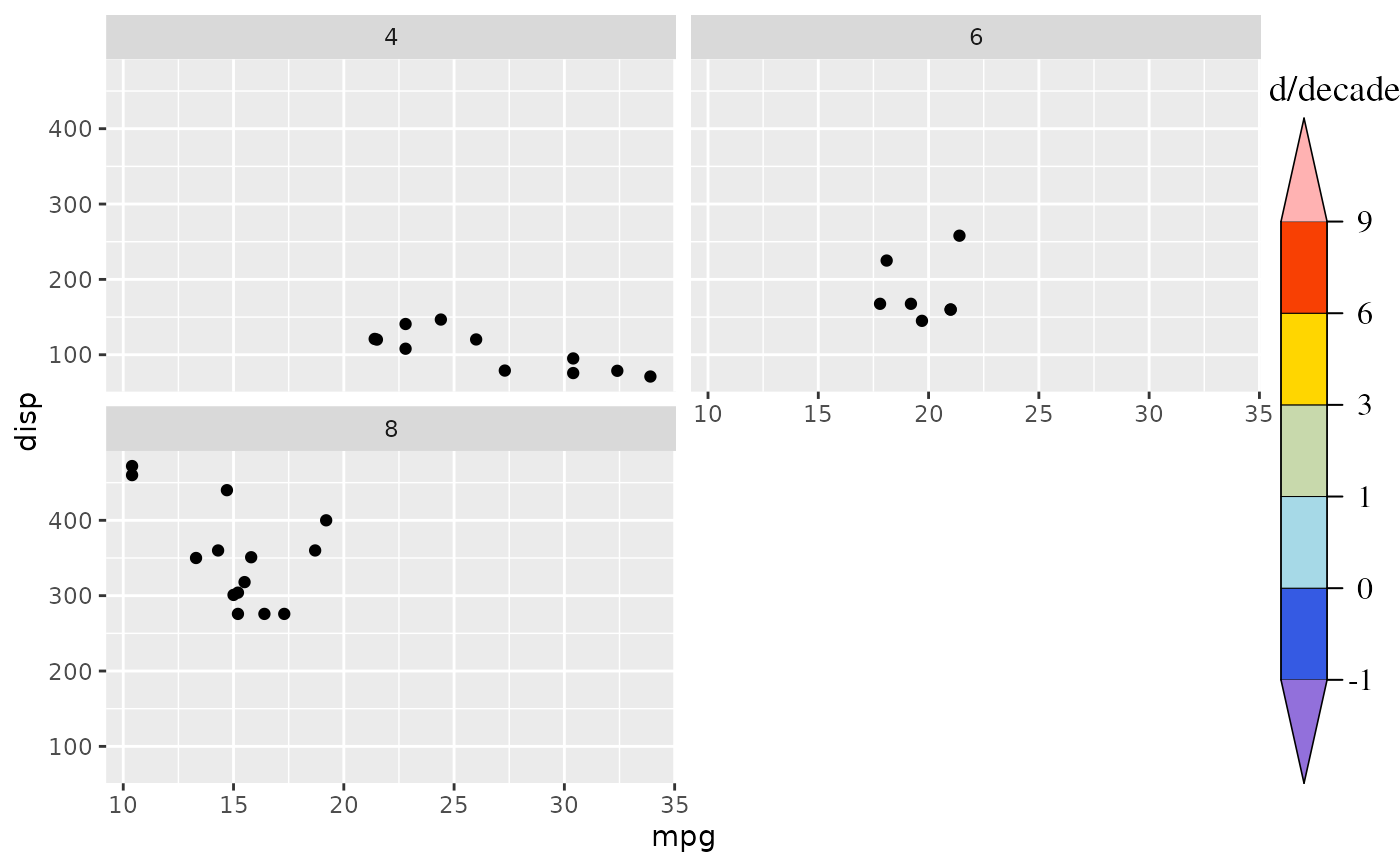
 p <- ggplot(mtcars, aes(mpg, disp)) + geom_point() +
facet_wrap(~cyl, nrow = 2)
add_colorbar(p, cbar)
p <- ggplot(mtcars, aes(mpg, disp)) + geom_point() +
facet_wrap(~cyl, nrow = 2)
add_colorbar(p, cbar)
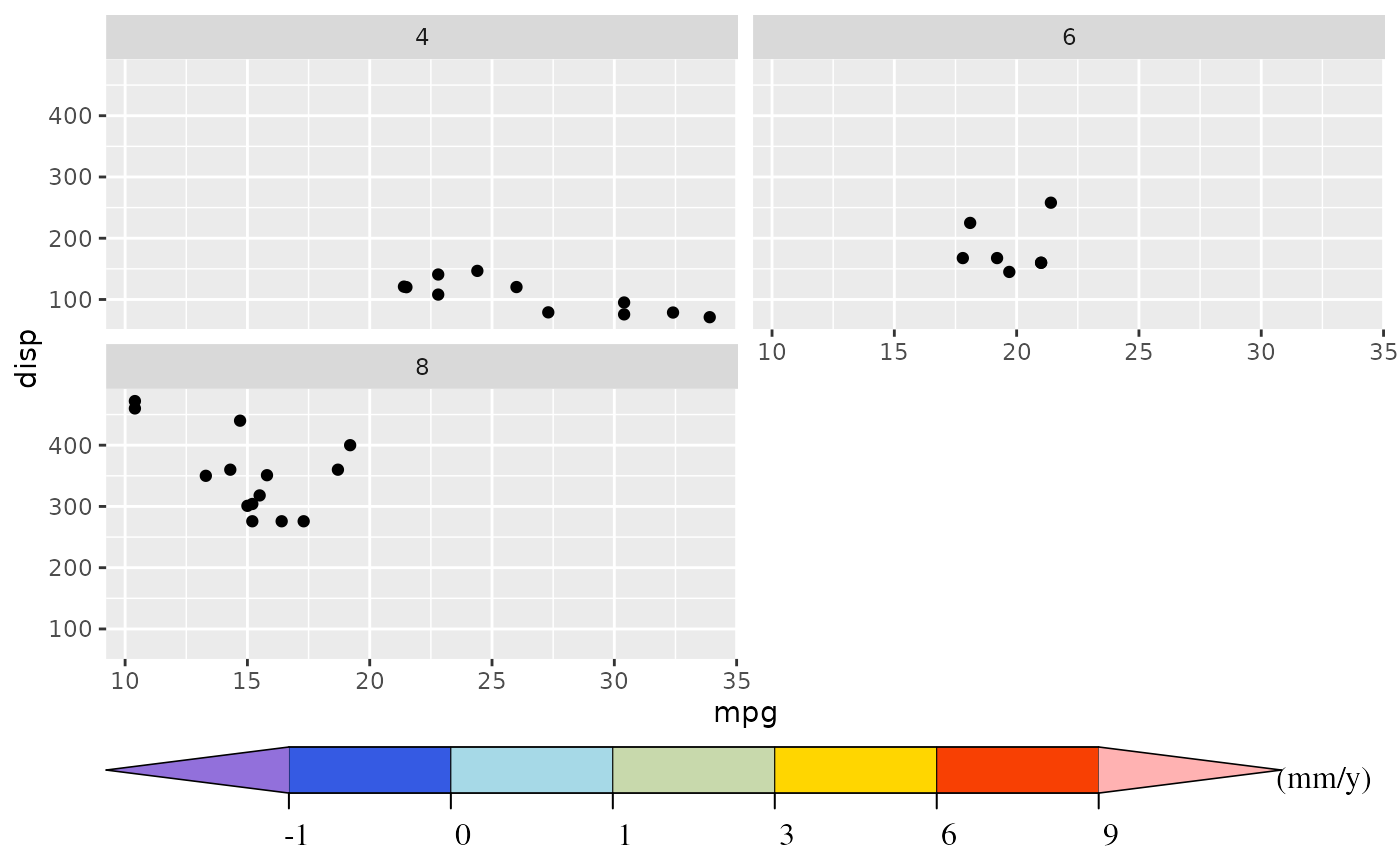
 ## Test the bottom
params$space = "bottom"
params$title = ""
cbar2 <- do.call(make_colorbar, params)
add_colorbar(p, cbar2, space = "bottom",
title = "(mm/y)",
legend.title = element_text(hjust = -5, vjust = -3, family = "Times"))
## Test the bottom
params$space = "bottom"
params$title = ""
cbar2 <- do.call(make_colorbar, params)
add_colorbar(p, cbar2, space = "bottom",
title = "(mm/y)",
legend.title = element_text(hjust = -5, vjust = -3, family = "Times"))
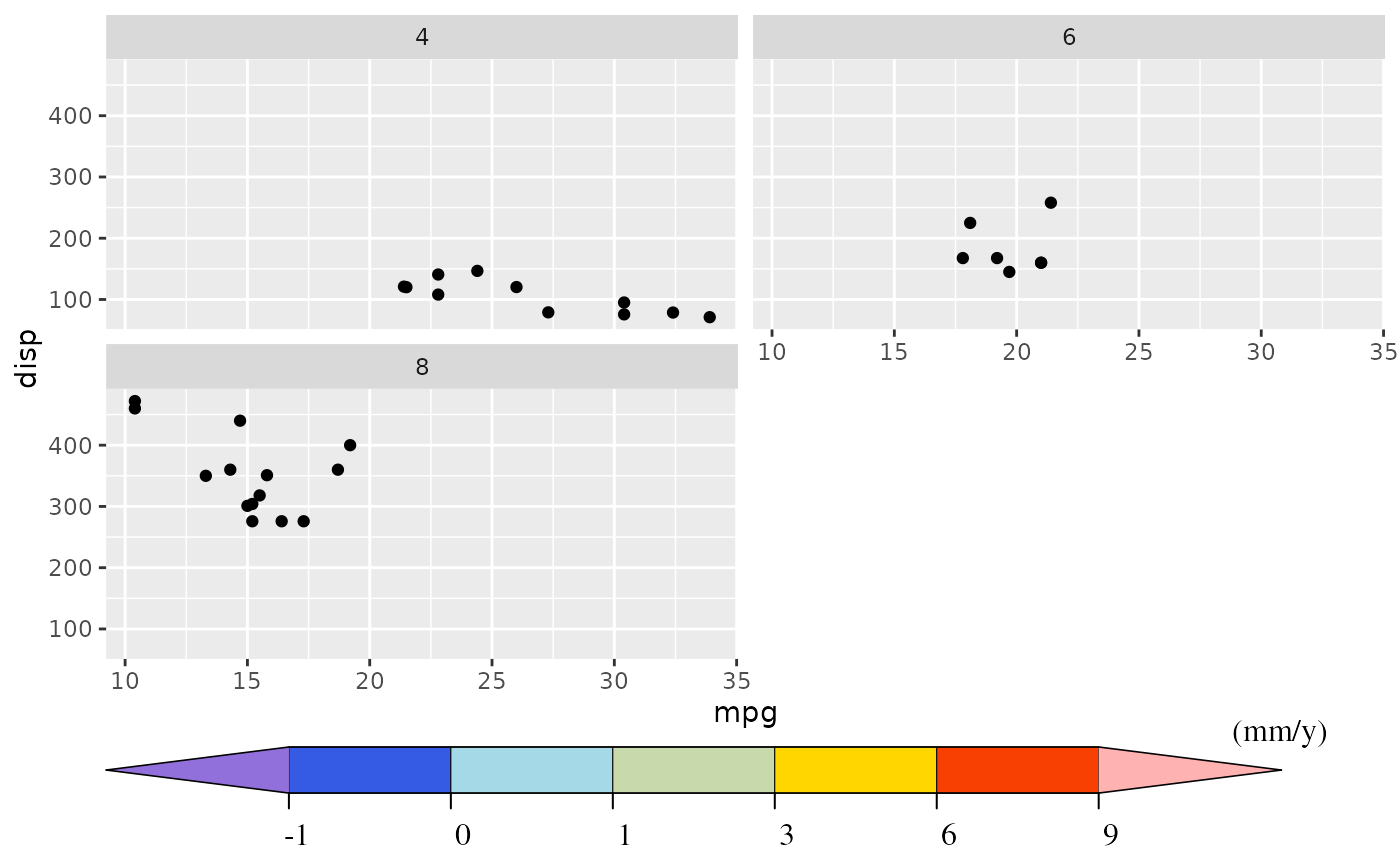 # Another option
title = element_grob_text(element_text(family = "Times", hjust = 1, vjust = 0, size = 12),
label = "(mm/y)", x = 0.98, y = 0.09)
add_colorbar(p, cbar2, space = "bottom") %>% add_grob(title)
# Another option
title = element_grob_text(element_text(family = "Times", hjust = 1, vjust = 0, size = 12),
label = "(mm/y)", x = 0.98, y = 0.09)
add_colorbar(p, cbar2, space = "bottom") %>% add_grob(title)