layer_barchart
layer_barchart.Rdlayer_barchart
layer_barchart(
  mapping = NULL,
  data = NULL,
  brks,
  cols,
  x = 0,
  y = 0,
  width = unit(0.5, "npc"),
  height = unit(0.5, "npc"),
  just = c(0, 0),
  fontsize = 12,
  theme = NULL,
  ...
)

geom_barchart(
  mapping = NULL,
  data = NULL,
  brks,
  cols,
  x = 0,
  y = 0,
  width = unit(0.5, "npc"),
  height = unit(0.5, "npc"),
  just = c(0, 0),
  fontsize = 12,
  theme = NULL,
  ...
)
Arguments
- mapping
Set of aesthetic mappings created by
aes(). If specified andinherit.aes = TRUE(the default), it is combined with the default mapping at the top level of the plot. You must supplymappingif there is no plot mapping.- data
The data to be displayed in this layer. There are three options:
If
NULL, the default, the data is inherited from the plot data as specified in the call toggplot().A
data.frame, or other object, will override the plot data. All objects will be fortified to produce a data frame. Seefortify()for which variables will be created.A
functionwill be called with a single argument, the plot data. The return value must be adata.frame, and will be used as the layer data. Afunctioncan be created from aformula(e.g.~ head(.x, 10)).- x
A numeric vector or unit object specifying x-location.
- y
A numeric vector or unit object specifying y-location.
- width
A numeric vector or unit object specifying width.
- height
A numeric vector or unit object specifying height.
- just
Adjustment for column placement. Set to
0.5by default, meaning that columns will be centered about axis breaks. Set to0or1to place columns to the left/right of axis breaks. Note that this argument may have unintended behaviour when used with alternative positions, e.g.position_dodge().- ...
Other arguments passed on to
layer()'sparamsargument. These arguments broadly fall into one of 4 categories below. Notably, further arguments to thepositionargument, or aesthetics that are required can not be passed through.... Unknown arguments that are not part of the 4 categories below are ignored.Static aesthetics that are not mapped to a scale, but are at a fixed value and apply to the layer as a whole. For example,
colour = "red"orlinewidth = 3. The geom's documentation has an Aesthetics section that lists the available options. The 'required' aesthetics cannot be passed on to theparams. Please note that while passing unmapped aesthetics as vectors is technically possible, the order and required length is not guaranteed to be parallel to the input data.When constructing a layer using a
stat_*()function, the...argument can be used to pass on parameters to thegeompart of the layer. An example of this isstat_density(geom = "area", outline.type = "both"). The geom's documentation lists which parameters it can accept.Inversely, when constructing a layer using a
geom_*()function, the...argument can be used to pass on parameters to thestatpart of the layer. An example of this isgeom_area(stat = "density", adjust = 0.5). The stat's documentation lists which parameters it can accept.The
key_glyphargument oflayer()may also be passed on through.... This can be one of the functions described as key glyphs, to change the display of the layer in the legend.
Examples
library(gg.layers)
library(ggplot2)
library(rcolors)
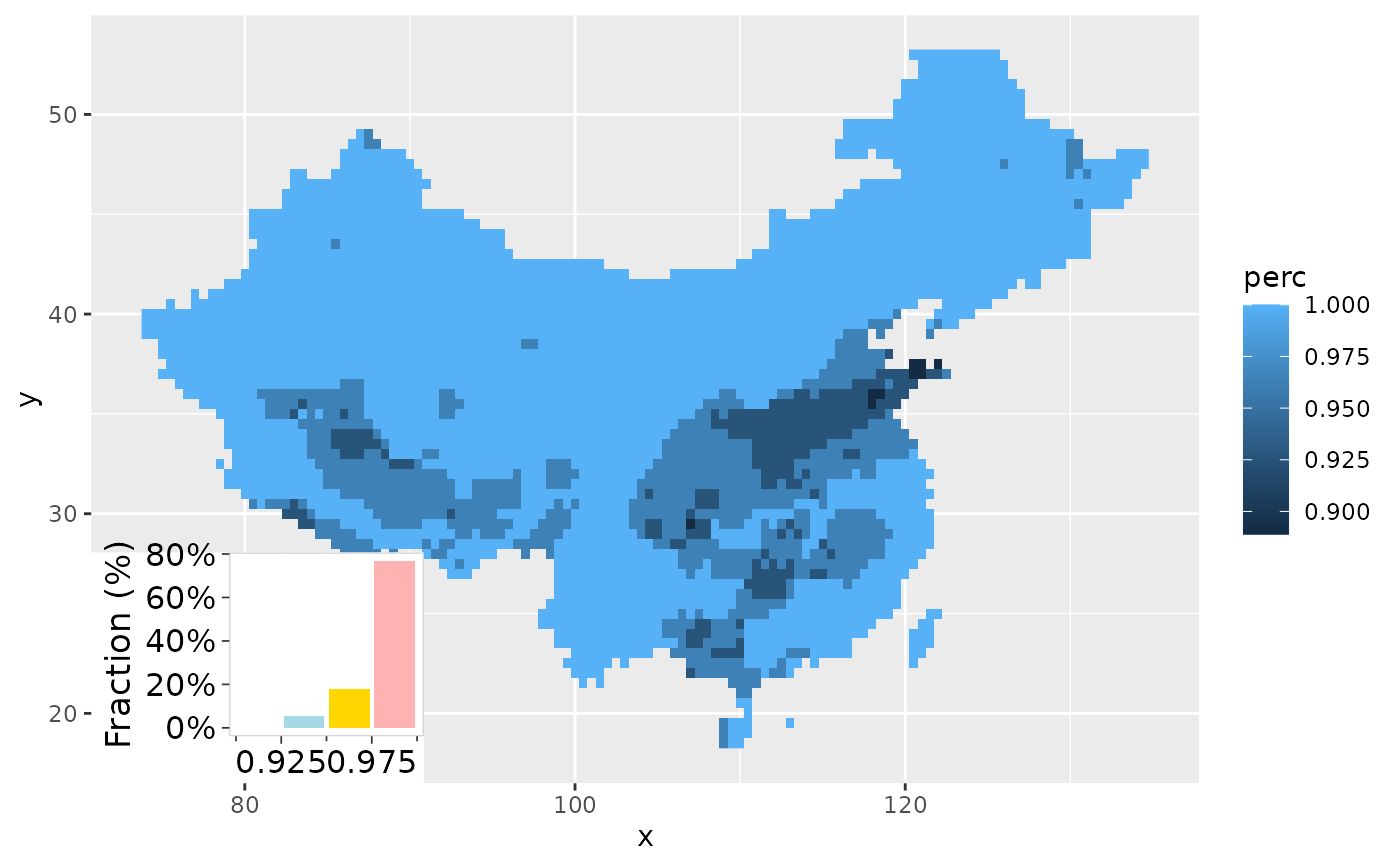
data("d_trendPerc")
d_mask <- mutate(d_trendPerc, mask = perc <= 0.99) # %>% as.data.frame()
brks = seq(0.9, 1, 0.025)
nbrk = length(brks) - 1
cols <- get_color(rcolors$amwg256, nbrk)
# the part of not significant
ggplot(data = d_mask, aes(x, y)) +
geom_raster(aes(fill = perc)) +
layer_barchart(aes(z = perc),
width = unit(0.3, "npc"),
height = unit(0.3, "npc"),
brks = brks, cols = cols)