geom_submap
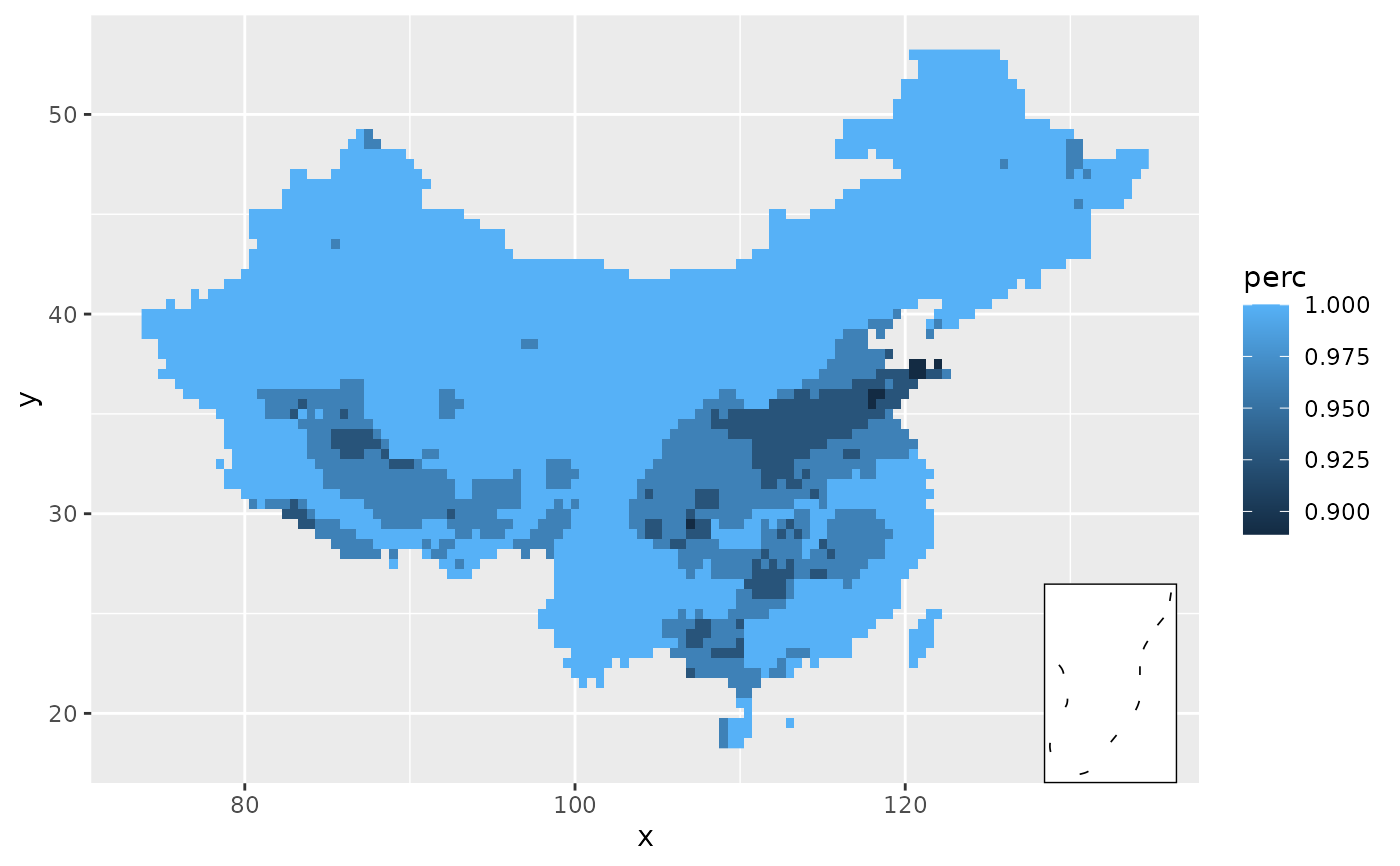
geom_submap.RdAdd an inset submap (e.g. the South China Sea, 南海) to a ggplot, placed in a
corner via a grid::viewport(). The submap content is independent of the main
plot data; see add_submap() for the map itself.
Arguments
- mapping
ignored (kept for API consistency); the submap does not use the main plot's aesthetics.
- data
An
sfobject of the submap boundary. IfNULL(default), the bundled bou_southsea dataset (the "十段线" national boundary in the South China Sea) is used.- x
A numeric vector or unit object specifying x-location.
- y
A numeric vector or unit object specifying y-location.
- width
A numeric vector or unit object specifying width.
- height
A numeric vector or unit object specifying height.
- just
A string or numeric vector specifying the justification of the viewport relative to its (x, y) location. If there are two values, the first value specifies horizontal justification and the second value specifies vertical justification. Possible string values are:
"left","right","centre","center","bottom", and"top". For numeric values, 0 means left alignment and 1 means right alignment.- ...
other parameters passed to
ggplot2::geom_sf().
Details
By default the submap is placed at the bottom-right corner
(x = 1, y = 0, just = c(1, 0)).
Examples
library(gg.layers)
library(ggplot2)

# shp = "Z:/ShapeFiles/ChinaBound2024/shp/bou1_4l_2024.shp"
data("d_trendPerc")

ggplot(d_trendPerc, aes(x, y)) +
  geom_raster(aes(fill = perc)) +
  geom_submap() + # South China Sea inset at the bottom-right corner
  coord_cartesian()